Hello everyone 👋,
In this article, we’ll instrument a simple Node.js API with OpenTelemetry traces.
OpenTelemetry is the new standard for distributed tracing and metrics. Trace data is used to monitor and troubleshoot complex distributed systems.
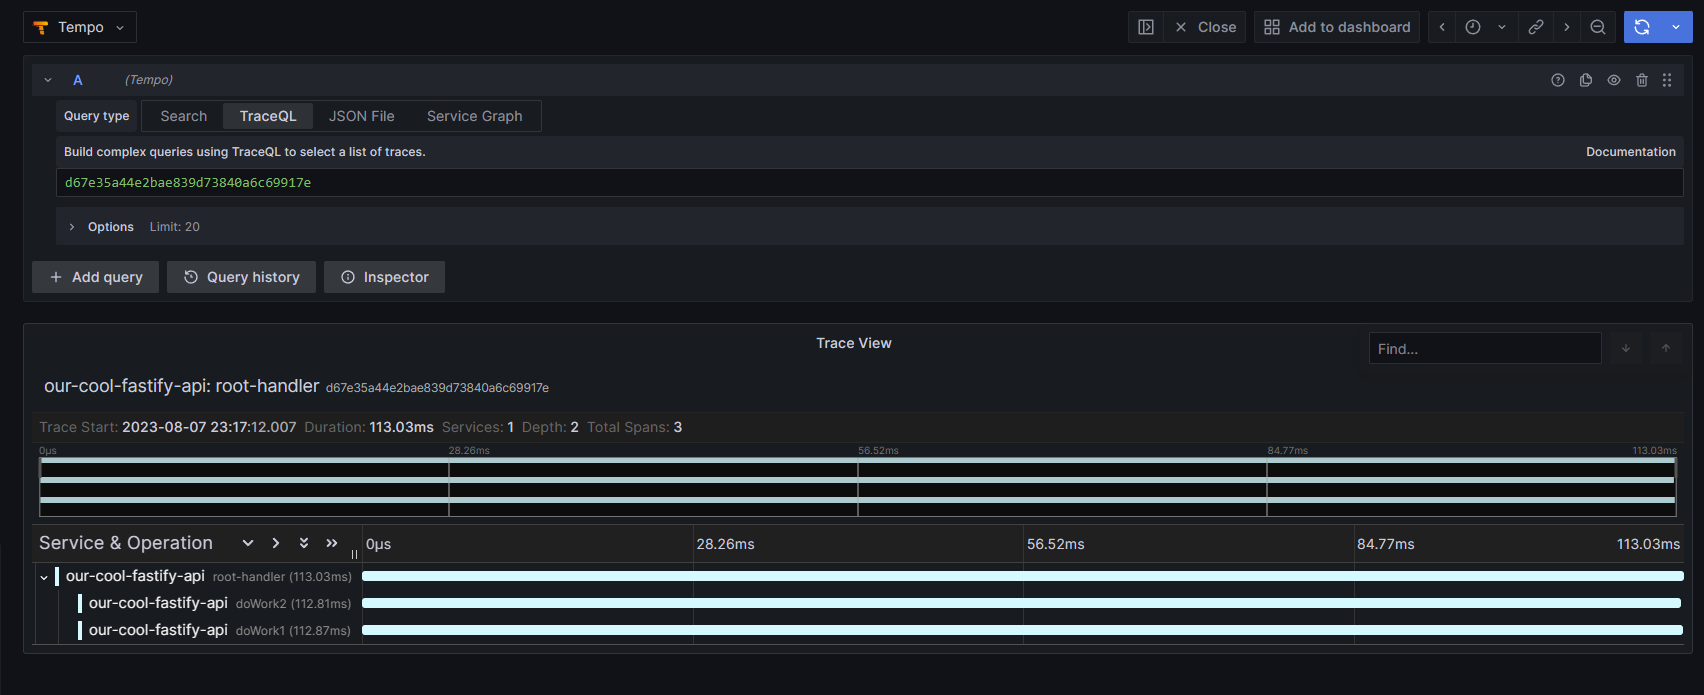
At the end of this article, we’ll have a Node.js API that is instrumented with OpenTelemetry and we’ll be able to see the traces in Grafana Tempo:
The API
Let’s start by setting up our NodeJS project by installing the dependencies:
npm install fastify
And the API that we’ll be instrumenting is the following:
// Require the framework and instantiate it
const fastify = require('fastify')({logger: true})


async function sleep(ms) {
  return new Promise(resolve => setTimeout(resolve, ms));
}

async function doWork1() {
  await sleep(1000);
  return {work_one: 1};
}

async function doWork2() {
  await sleep(1000);
  return {work_two: 2};
}

// Declare a route
fastify.get('/', async function handler(request, reply) {
  let [doWork1Data, doWork2Data] = await Promise.all([doWork1(), doWork2()])
  reply.send({hello: 'world', data: {...doWork1Data, ...doWork2Data}})
})

// Run the server!
fastify.listen({port: 4000}, (err) => {
  if (err) {
    fastify.log.error(err)
    process.exit(1)
  }
})
Assume that in the functions doWork1 and doWork2 we’re doing some heavy work that takes 1 second to complete like
complex ElasticSearch aggregation queries, or some other I/O operation.
OpenTelemetry - NodeJS SDK
Let’s start by installing the OpenTelemetry NodeJS SDK:
Note: I’m following the instructions from OpenTelemetry - JavaScript Manual
npm install @opentelemetry/sdk-node @opentelemetry/api @opentelemetry/resources @opentelemetry/semantic-conventions
Now that we have the packages installed we can start instrumenting our API.
Update the API code to the following:
// Declare a route
// [...]

// Open Telemetry Setup
const {NodeSDK} = require('@opentelemetry/sdk-node');
const {ConsoleSpanExporter} = require('@opentelemetry/sdk-trace-node');
const {Resource} = require('@opentelemetry/resources');
const {SemanticResourceAttributes,} = require('@opentelemetry/semantic-conventions');

const sdk = new NodeSDK({
  resource: new Resource({
    [SemanticResourceAttributes.SERVICE_NAME]: 'our-cool-fastify-api',
    [SemanticResourceAttributes.SERVICE_VERSION]: '0.1.0',
  }),
  traceExporter: new ConsoleSpanExporter(),
});
sdk.start()

// Run the server!
// [...]
Note: imports should be placed at the top of the file.
Now the OpenTelemetry SDK is configured to export the traces to the console. Later we’ll configure it to export into an OpenTelemetry Collector.
OpenTelemetry - Manual Instrumentation
This article focuses on manual instrumentation, if you’re interested in automatic instrumentation, check out the OpenTelemetry Automatic Instrumentation page.
Tracing the API
Update the API code to the following:
- First declare the tracer:
const opentelemetry = require('@opentelemetry/api');

const tracer = opentelemetry.trace.getTracer(
  'cool-api-root-handlers',
  'v1.0.0',
);
- Then wrap the handler functions with the tracer:
async function doWork1() {
  return await tracer.startActiveSpan('doWork1', async (span) => {
    span.setAttribute('work1', 'work1');
    await sleep(1000);
    span.end()
    return {work_one: 1};
  });
}

async function doWork2() {
  return await tracer.startActiveSpan('doWork2', async (span) => {
    span.setAttribute('work2', 'work2');
    await sleep(1000);
    span.end()
    return {work_two: 2};
  });
}

// Declare a route
fastify.get('/', async function handler(request, reply) {
  await tracer.startActiveSpan('root-handler', async (span) => {
    span.setAttribute('path', '/');

    let [doWork1Data, doWork2Data] = await Promise.all([doWork1(), doWork2()])

    span.end()
    reply.send({hello: 'world', data: {...doWork1Data, ...doWork2Data}})
  });
})
- Run the API and check the console output:
{
  traceId: '6962e5a9a070979ab2409af6e6b4b1e9',
  parentId: 'b991c5da04183817',
  traceState: undefined,
  name: 'doWork1',
  id: '8ef739b49dbc41eb',
  kind: 0,
  timestamp: 1691435811423000,
  duration: 1006130,
  attributes: { work1: 'work1' },
  status: { code: 0 },
  events: [],
  links: []
}
Our API is now instrumented with OpenTelemetry!
Visualizing the traces
To visualize the traces, we’ll use Grafana and Tempo. In this section, we’ll set up a local Grafana and Tempo instance using Docker and Docker Compose. I’m assuming that you have familiarity with Docker, Docker Compose, and Grafana.
Grafana and Tempo
To set up Grafana and Tempo, I’ll use configuration files from this GitHub repo.
Create a docker-compose.yaml file with the following content:
version: "3"
services:
  tempo:
    image: grafana/tempo:latest
    command: [ "-config.file=/etc/tempo.yaml" ]
    volumes:
      - ./tempo.yaml:/etc/tempo.yaml
      - ./tempo-data:/tmp/tempo
    ports:
      - "3200"   # tempo
      - "4317"  # otlp grpc
      - "4318"  # otlp http

  grafana:
    image: grafana/grafana:9.4.3
    ports:
      - "3000:3000"
Create a tempo.yaml file with the following content. It’s a minimal configuration for Tempo.
server:
  http_listen_port: 3200

distributor:
  receivers: # this configuration will listen on all ports and protocols that tempo is capable of.
    otlp:
      protocols:
        http:
        grpc:

ingester:
  max_block_duration: 5m               # cut the headblock when this much time passes. this is being set for demo purposes and should probably be left alone normally

compactor:
  compaction:
    block_retention: 1h                # overall Tempo trace retention. set for demo purposes

storage:
  trace:
    backend: local                     # backend configuration to use
    wal:
      path: /tmp/tempo/wal             # where to store the the wal locally
    local:
      path: /tmp/tempo/blocks
Now run docker-compose up and wait for the services to start.
Grafana - Tempo Datasource
Open http://localhost:3000 in your browser and log in with the default credentials:
- username:
admin - password:
admin
Add a new datasource:
- Click on the gear icon on the left sidebar
- Click on
Data Sources - Click on
Add data source - Select
Tempofrom the list - Set the URL to
http://tempo:3200 - Click on
Save & Test
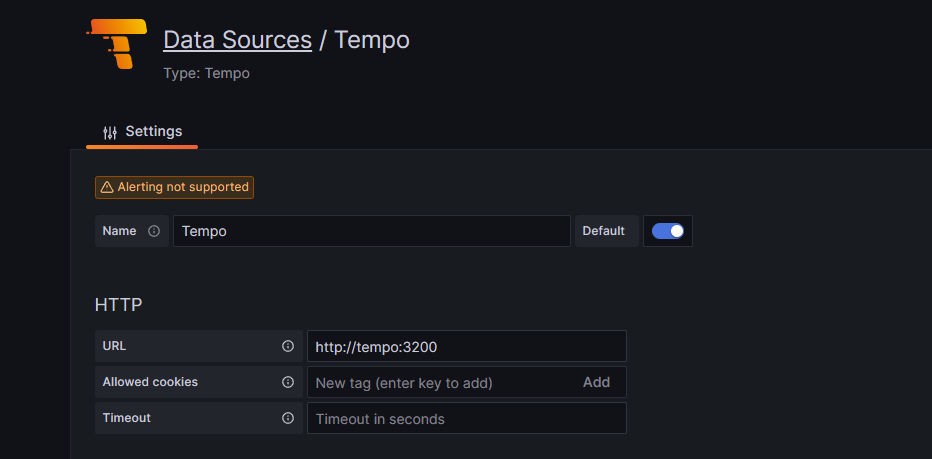
Now we have a working Grafana instance with a Tempo datasource.
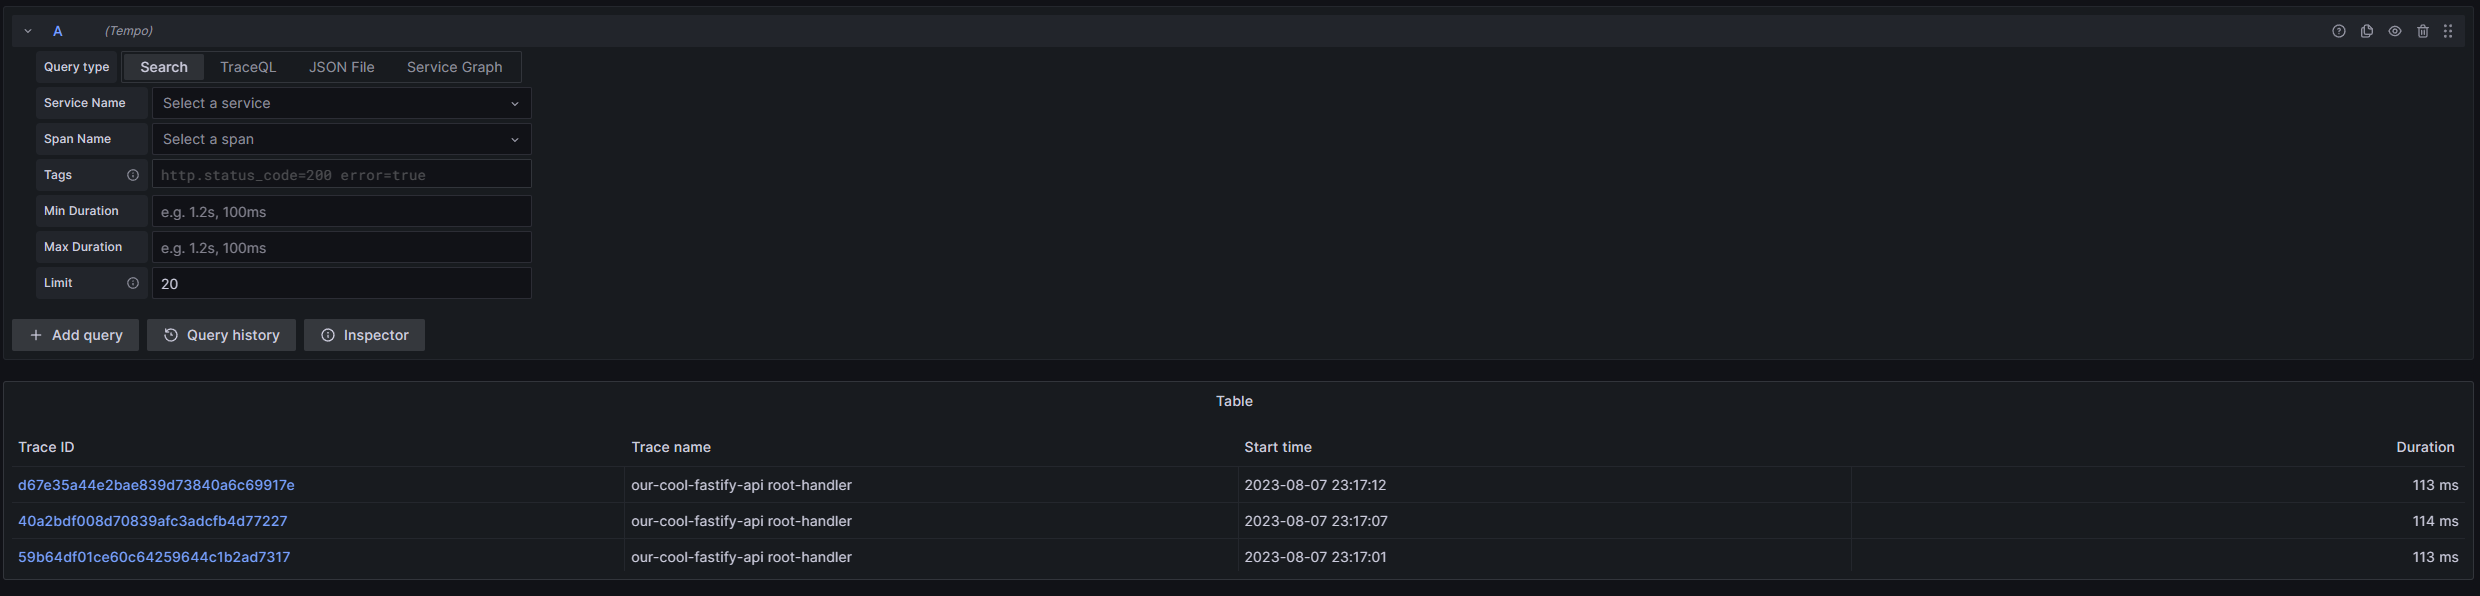
We can explore the data from tempo by visiting http://localhost:3000/explore and
selecting the Tempo datasource.
OpenTelemetry Collector
The OpenTelemetry Collector is a agent that can receive, process, and export telemetry data. We’ll use it as a Sidecar to our API. The Collector will receive the traces from the API and export them to Tempo.
OpenTelemetry Collector - Configuration
Add the collector to the docker-compose.yaml file:
services:
  otel-collector:
    image: otel/opentelemetry-collector-contrib
    volumes:
      - ./collector.yaml:/etc/otelcol-contrib/config.yaml
    ports:
      - "1888:1888" # pprof extension
      - "8888:8888" # Prometheus metrics exposed by the collector
      - '8889:8889' # Prometheus exporter metrics
      - '13133:13133' # health_check extension
      - "4317:4317" # OTLP gRPC receiver
      - "4318:4318" # OTLP http receiver
      - "55679:55679" # zpages extension
# [...]
Create a collector.yaml file with the following content. It’s a minimal configuration for the Collector that forwards
batched traces to tempo:4317.
receivers:
  otlp:
    protocols:
      grpc:
      http:

processors:
  batch:

exporters:
  otlp:
    endpoint: "tempo:4317"
    tls:
      insecure: true

extensions:
  health_check:
  pprof:
  zpages:

service:
  extensions: [health_check, pprof, zpages]
  pipelines:
    traces:
      receivers: [otlp]
      processors: [batch]
      exporters: [otlp]
    metrics:
      receivers: [otlp]
      processors: [batch]
      exporters: [otlp]
    logs:
      receivers: [otlp]
      processors: [batch]
      exporters: [otlp]
If you run docker-compose up again the otel-collector service should start. The console output should look like this:
otel-collector-1  | 2023-08-07T19:37:11.863Z  info    otlpreceiver/otlp.go:70 Starting GRPC server on endpoint 0.0.0.0:4317   {"kind": "receiver", "name": "otlp", "pipeline": "traces"}
otel-collector-1  | 2023-08-07T19:37:11.863Z  info    otlpreceiver/otlp.go:88 Starting HTTP server on endpoint 0.0.0.0:4318   {"kind": "receiver", "name": "otlp", "pipeline": "traces"}
otel-collector-1  | 2023-08-07T19:37:11.864Z  info    service/service.go:129  Everything is ready. Begin running and processing data.
Now back to the API
The OpenTelemetry SDK is configured to output traces to the console. We’ll change that to output the traces to the OpenTelemetry Collector.
Install the OLTP exporter packages:
npm install --save @opentelemetry/exporter-trace-otlp-proto @opentelemetry/exporter-metrics-otlp-proto
Now replace the ConsoleSpanExporter with OTLPTraceExporter:
const {OTLPTraceExporter} = require("@opentelemetry/exporter-trace-otlp-proto");

// Open telemetry setup
const sdk = new NodeSDK({
    resource: new Resource({
        [SemanticResourceAttributes.SERVICE_NAME]: 'our-cool-fastify-api',
        [SemanticResourceAttributes.SERVICE_VERSION]: '0.1.0',
    }),
    traceExporter: new OTLPTraceExporter(),
});
sdk.start()
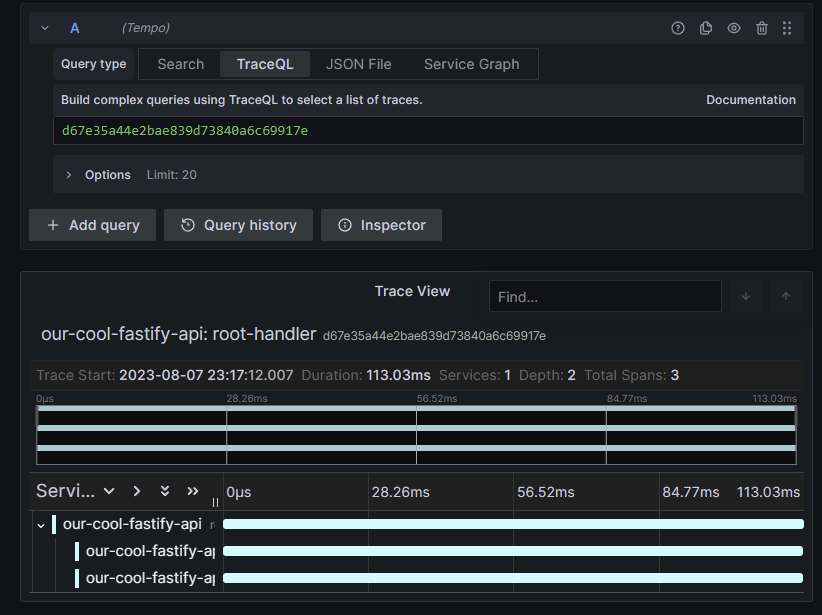
If you run the API with node main.js and visit / in your browser you should see the traces shortly in Tempo.
And that’s it! You now have a working OpenTelemetry setup with Tempo and Grafana.
Conclusion
OpenTelemetry combined with Tempo are powerful tools for monitoring and troubleshooting your complex systems.
However, the setup can be quite complex if you’re not familiar with the tools.
Thanks for reading! 📚
Additional Resources
Docker Compose:
version: "3"
services:
  otel-collector:
    image: otel/opentelemetry-collector-contrib
    volumes:
      - ./collector.yaml:/etc/otelcol-contrib/config.yaml
    ports:
      - "1888:1888" # pprof extension
      - "8888:8888" # Prometheus metrics exposed by the collector
      - '8889:8889' # Prometheus exporter metrics
      - '13133:13133' # health_check extension
      - "4317:4317" # OTLP gRPC receiver
      - "4318:4318" # OTLP http receiver
      - "55679:55679" # zpages extension


  tempo:
    image: grafana/tempo:latest
    command: [ "-config.file=/etc/tempo.yaml" ]
    volumes:
      - ./tempo.yaml:/etc/tempo.yaml
      - ./tempo-data:/tmp/tempo
    ports:
      - "3200"   # tempo
      - "4317"  # otlp grpc
      - "4318"  # otlp http

  grafana:
    image: grafana/grafana:9.4.3
    ports:
      - "3000:3000"
Main.js
// Require the framework and instantiate it
const fastify = require('fastify')({logger: true})
const {NodeSDK} = require('@opentelemetry/sdk-node');
const {ConsoleSpanExporter} = require('@opentelemetry/sdk-trace-node');
const {Resource} = require('@opentelemetry/resources');
const {SemanticResourceAttributes,} = require('@opentelemetry/semantic-conventions');

const opentelemetry = require('@opentelemetry/api');
const {OTLPTraceExporter} = require("@opentelemetry/exporter-trace-otlp-proto");

const tracer = opentelemetry.trace.getTracer(
    'cool-api-root-handlers',
    'v1.0.0',
);

async function sleep(ms) {
    return new Promise(resolve => setTimeout(resolve, ms));
}

async function doWork1() {
    return await tracer.startActiveSpan('doWork1', async (span) => {
        span.setAttribute('work1', 'work1');
        await sleep(100);
        span.end()
        return {work_one: 1};
    });
}

async function doWork2() {
    return await tracer.startActiveSpan('doWork2', async (span) => {
        span.setAttribute('work2', 'work2');
        await sleep(100);
        span.end()
        return {work_two: 2};
    });
}

// Declare a route
fastify.get('/', async function handler(request, reply) {
    await tracer.startActiveSpan('root-handler', async (span) => {
        span.setAttribute('path', '/');

        let [doWork1Data, doWork2Data] = await Promise.all([doWork1(), doWork2()])

        span.end()
        reply.send({hello: 'world', data: {...doWork1Data, ...doWork2Data}})
    });
})

// Open telemetry setup
const sdk = new NodeSDK({
    resource: new Resource({
        [SemanticResourceAttributes.SERVICE_NAME]: 'our-cool-fastify-api',
        [SemanticResourceAttributes.SERVICE_VERSION]: '0.1.0',
    }),
    traceExporter: new OTLPTraceExporter(),
});
sdk.start()

// Run the server!
fastify.listen({port: 4000}, (err) => {
    if (err) {
        fastify.log.error(err)
        process.exit(1)
    }
})