Hi 👋
This is a short tutorial describing how to monitor your Kubernetes cluster container logs using Loki stack. But why? Because it is easier to view, filter your logs in Grafana and to store them persistently in Loki rather than viewing them in a terminal.
Let’s get started! Assuming you already have Microk8s installed, enable the following addons:
You can enable an add-on by running microk8s enable. Ex: microk8s enable dns
addons:
  enabled:
    dns                  # CoreDNS
    ha-cluster           # Configure high availability on the current node
    metrics-server    # K8s Metrics Server for API access to service metrics
    storage               # Storage class; allocates storage from host directory
Note: Microk8s comes with a bundled kubectl and helm3. Just run microk8s kubectl or microk8s helm3. If you want to use your host kubectl you can configure it via: microk8s config > ~/.kube/config.
Warning: Be extra careful when running the microk8s config > ~/.kube/config command because it will overwrite the old config file.
Then proceed by installing Loki. Loki will store all the logs using object storage. This is efficient but the trade-off is that you can’t do complex aggregations and searches against your data. We are going to install Loki for exploration purposes but if you’re looking for a production ready version, check out the loki distributed helm chart.
Run the following helm commands to install Loki. You may want to install helm or use microk8s helm3 command.
helm repo add grafana https://grafana.github.io/helm-charts

helm install loki grafana/loki -
You should get the following pods and services by running kubectl get pods and kubectl get services:
NAME                        READY   STATUS        RESTARTS   AGE
loki-0                      1/1     Running       0          9m8s

NAME            TYPE        CLUSTER-IP       EXTERNAL-IP   PORT(S)    AGE
kubernetes      ClusterIP   10.152.183.1     <none>        443/TCP    54m
loki-headless   ClusterIP   None             <none>        3100/TCP   9m23s
loki            ClusterIP   10.152.183.187   <none>        3100/TCP   9m23s
Now, we can safely install Promtail. Promtail will import all the container logs into Loki and it should work auto-magically by auto-discovering all the pods that are running inside your cluster.
To let Promtail know about our existing Loki’s address, we can give it the service URL: http://loki-headless.default.svc.cluster.local:3100/loki/api/v1/push.
helm install promtail grafana/promtail --set config.lokiAddress=http://loki-headless.default.svc.cluster.local:3100/loki/api/v1/push
Finally, we need to visualize the logs using Grafana. Install it by running the helm command and then, edit the service to change its type from ClusterIP to NodePort.
Changing the service type to NodePort will allow you to visit Grafana in your browser without the need of adding an ingester.
❗❗To use vscode as the default editor export the following environment variable: KUBE_EDITOR=code -w
helm install grafana grafana/grafana

 kubectl edit service/grafana
# Change metadata.spec.type to NodePort
# Grab the service's port using kubectl get services and look for 32204:
# grafana                         NodePort    10.152.183.84    <none>        80:32204/TCP   6d
Note: If you’re on Windows to access the service you will need to run kubectl cluster-info and use the IP address of the cluster. On Linux you should be able to access http://localhost:32204.
kubectl cluster-info
Kubernetes control plane is running at https://172.20.138.170:16443
To access Grafana visit: http://172.20.138.170:32204 where 32204 is the service’s NodePort.
Grab your Grafana admin password by following the instructions from the helm notes. The notes are displayed after Grafana has been installed. If you don’t have base64 on your OS check out CyberChef, it can decode base64 text.
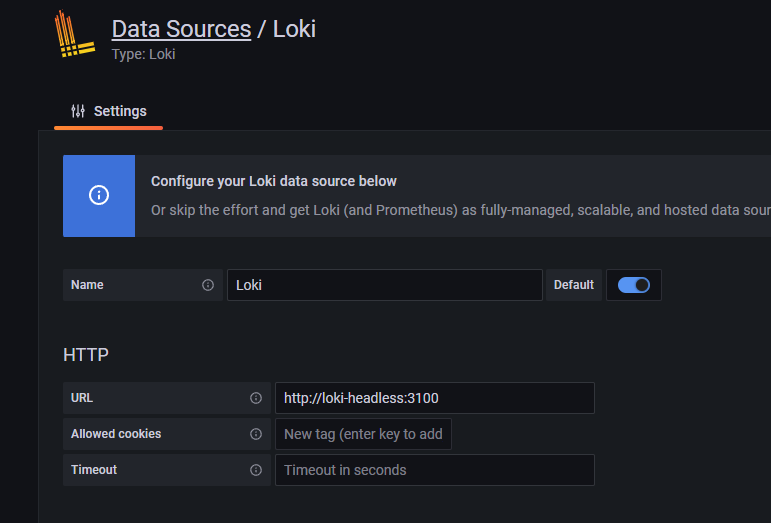
After you’ve successfully logged in, head to Settings -> DataSources and add the Loki data source.
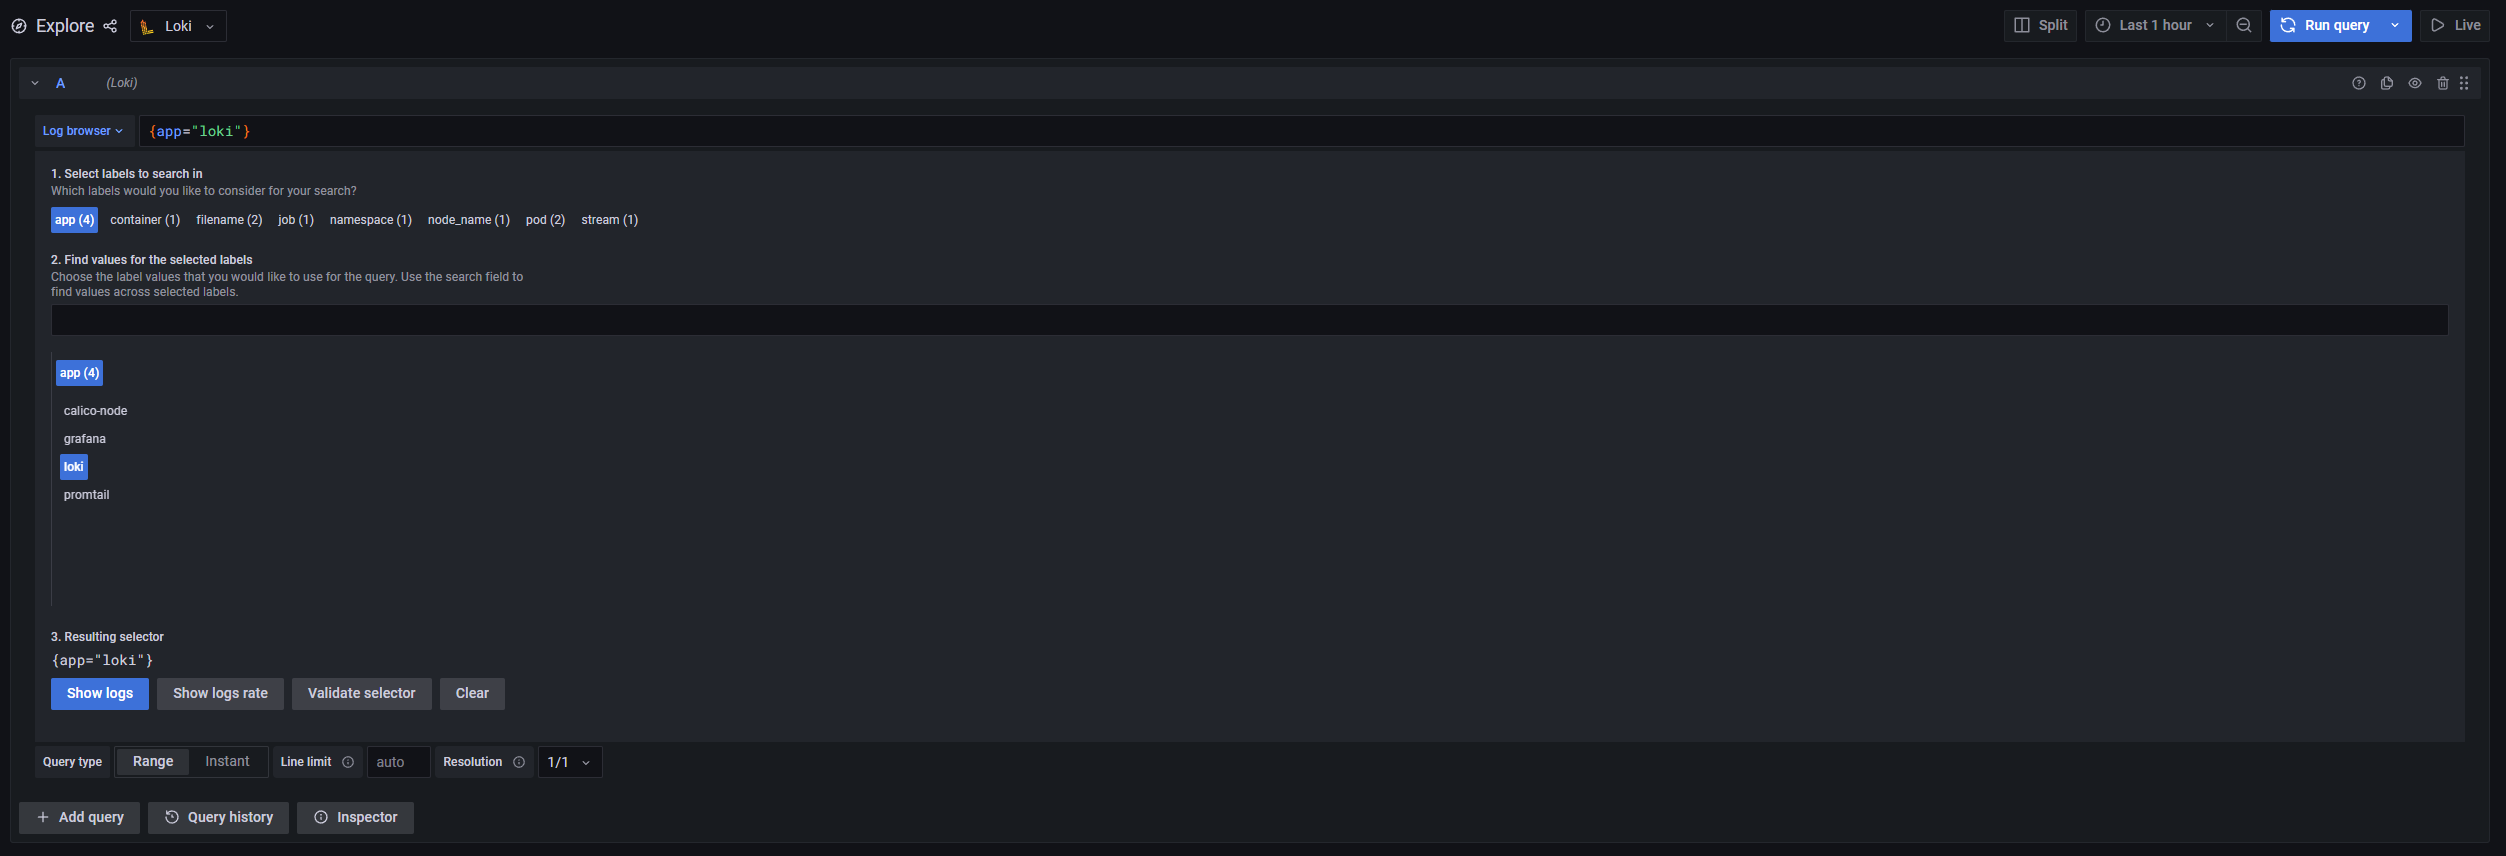
 Head back to the Explore menu and display Loki’s logs using the Loki data source in Grafana. You can click log browser to view all available values for the app label.
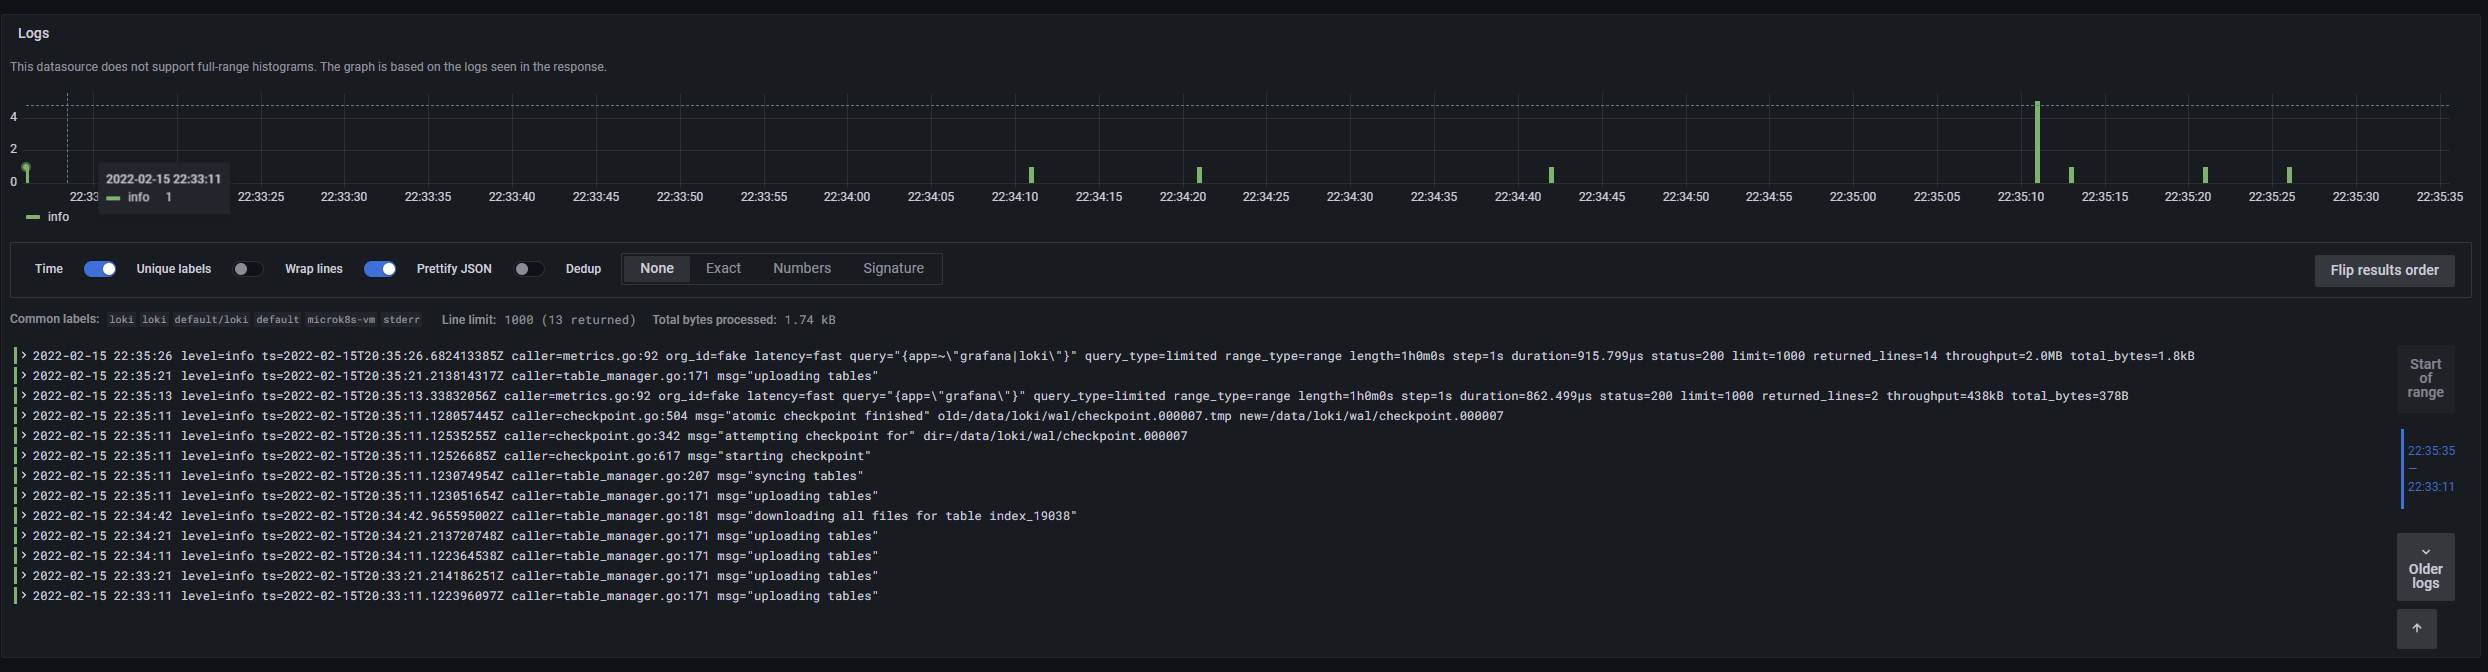 Promtail should now import logs into Loki and create labels dynamically for each newly created container. If you followed along, congratulations!
Thanks for reading and happy hacking! 🔧